Statistics:

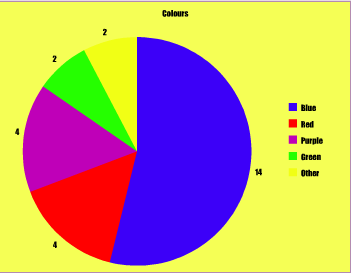
Last week our class did a survey. Asking around the classroom what are their favorite things. Right now I am starting with colours as you can see. The next thing we did after we had done the Survey was create tally charts. We did the Tally chart in our maths books.
The tally chart had colours, the tally and total. The most colours that our class students liked the most was Blue. After we did the Tally chart we had created a graph.
No comments:
Post a Comment
Note: Only a member of this blog may post a comment.